Emotions Tweeted During 2012 Election
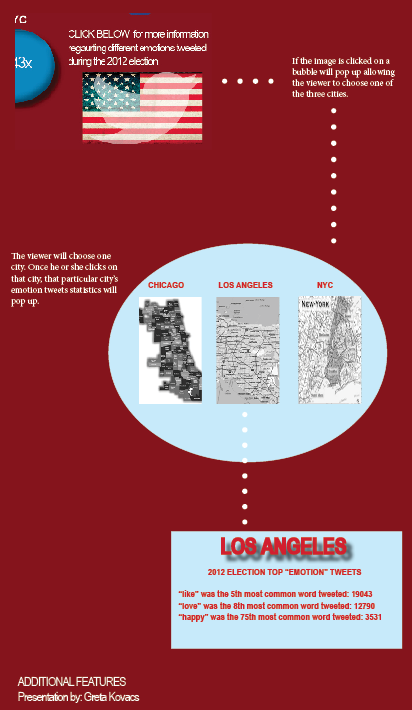
This infographic focuses on telling a story about how and what people were tweeting during the 2012 elections. The illustration focuses on the emotion characters tweeted (within the top 100 tweets) that were tweeted in three cities: NYC, Los Angeles, and Chicago.
Below is the sketch:
Below is the infographic:


